
Introduction:
Eastern State Penitentiary
The Eastern State Penitentiary opened its doors in October 1829 and at the time of its opening, the building was the second largest in the United States. Construction started in 1822 with designs from architect John Haviland who intended to use the building’s gothic and medieval appearance to deter crime. The building’s architecture served as a model for the design of other prisons built in the 19th century.
In addition to its physical appearance, Eastern State Penitentiary is famous for being the first true “penitentiary.” Eastern State set the precedence for global prison reform. Alex de de Tocqueville wrote in 1831, “can there be a combination more powerful for reformation than solitude…leads [a prisoner] through reflection to remorse, through religion to hope; makes him industrious by…idleness?”
And though many agreed with this sentiment, Charles Dickens wrote in 1842, “I am persuaded that those who designed this system… do not know what it is they are doing… I hold the slow and daily tampering with the mysteries of the brain to be immeasurably worse than any torture of the body.” Eastern State Penitentiary continued this system of isolation and penitence until 1913 when, according to the Eastern State Penitentiary Historical Site, it “collapsed under the weight of its own lofty morals.”
The state of Pennsylvania officially closed the prison in 1971, but not before it joined the national historic landmark register in 1965. The prison reopened in 1994 as a historic site and with renewed purpose to “engage in dialogue and deepen the national conversation about criminal justice.” Over its 142 year operation as a prison, Eastern State Penitentiary held an estimated 80,000 prisoners, including Al Capone and Slick Willie.
Data Biography
The “Eastern State Penitentiary Admission Book A” Data Set
The data set for this project was produced by library science students at Drexel University. It should be noted that “despite the best efforts of all involved, mistakes often occur during the creation of datasets. Scholars are encouraged to consult the original records, in digital or physical format.” The students published the data set June 13th, 2016 under the creative commons by 4.0 DEED license.
The original (physical and digitized) records are a part of the Records of Eastern State Penitentiary, property of American Philosophical Society. The collection is organized into four series, the first being Bound Volumes which contain five admissions records. Books A, B, and D were kept by Eastern State’s first Moral Instructor, Thomas Larcombe, who served at the penitentiary for roughly four decades. This particular volume of admissions records (Book A) was created between 1830-1839.
Analysis and Visualization
Key Focus: Outward appearance of social identity in the Eastern State Penitentiary.
Gender and ethnicity are two critical pieces of an individual’s social identity because it is the first thing another individual will notice upon seeing them. With the history of gender and racial prejudice in America it is hard to believe then, that any of this data is coincidence. A large portion of the data is blank, or null, and this could be for a number of reasons. I decided against filtering out this null data so I could portray a true representation of the sheer number of prisoners. The interface does, however, allow the view to customize their own filters, and I encourage you to do so to get a different visual that look only at the “verified” data.
Sheet 1:
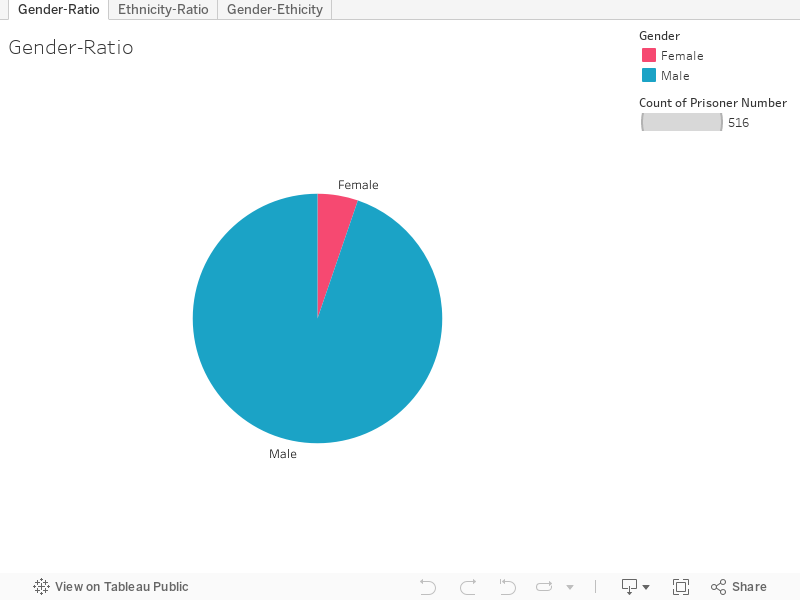
Gender Ratio of Prisoners
In my first interactions with this data set, I also noticed that gender was only marked if that person was a woman. I made the decision to replace the null data in the gender column with male. This is backed up by my research on the prison itself, the ratio of women to men in this visual is fairly accurate, even though it is not perfect. See the Philadelphia Encyclopedia essay for more context.
Sheet 2:
Racial/Ethnic Ratio of Prisoners
The data also had a mixture of labels for race/ethnicity, which I simplified into one singular label for a more concise representation in the visual. It should be noted, however, that even these labels are not labels we would use today in the twenty-first century, many are now considered inappropriate terms. As a historian of American social history during the 19th century, I am confident in my decision to alter the data set ethnic/racial labels. The ultimate goal in this particular visualization is to provide a basic understanding of the disproportion of race and ethnicity amongst prisoners.
Sheet 3:
Intersection of Race and Gender amongst Prisoners
Even more disproportionate are the rations of male to female races/ethnicities. This visual further supports the argument that prisoners were more likely to be Black or mixed race than white. It also demonstrates how the ratio is even further skewed when gender is added into the mix. Amongst female prisoners, the ratio of people of color to white people is much more disproportionate.
Resources
https://philadelphiaencyclopedia.org/essays/eastern-state-penitentiary
https://www.easternstate.org/explore/exhibits/big-graph
https://www.easternstate.org/research
https://www.easternstate.org/about-eastern-state
https://www.easternstate.org/explore/online-tour
https://www.smithsonianmag.com/history/eastern-state-penitentiary-a-prison-with-a-past-14274660
https://repository.upenn.edu/mead/22
https://search.amphilsoc.org/collections/view?docId=ead/Mss.365.P381p-ead.xml#SeriesI.Admissionledgersandboundvolumes:~:text=Detailed%20Inventory-,Series%20I.%20Admission%20ledgers%20and%20bound%20volumes,-1830%2D1892http://
creativecommons.org/licenses/by/4.0/